
Our musculoskeletal system is a magnificent, but sensitive apparatus. We navigate life through stages of our bodies being capable of a variety of different feats. We have an incredible ability to recover from injury when we’re kids, and athletic prowess when we’re young adults, but then something happens at a certain age — the condition of our body very slowly starts to deteriorate. When we fall, it’s harder to get back up. When we exercise, it takes a bit longer to recover. Eventually, if we’re not taking proper care of our bodies, any sudden impact could have devastating consequences.
It’s only because we can forecast these changes that we can prevent their onset through some form of intervention: changing our diet, exercising, practicing yoga, or getting blood tests are all common actions for increasing physical longevity.
If we treated our adult bodies like we did when we were kids, we’d be putting ourselves at high risk in the future.
This is the current state of the electric grid.
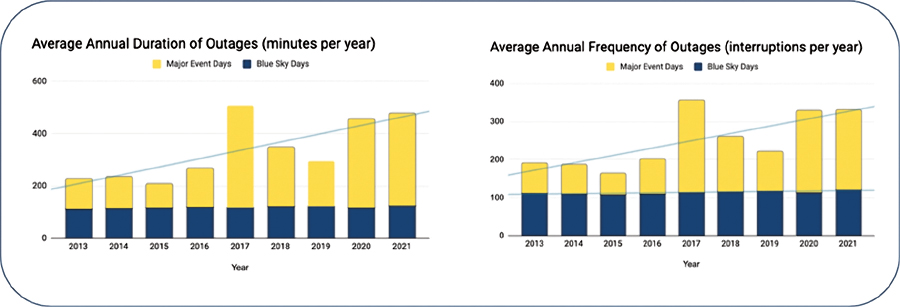
Energy Information Administration Reliability Metrics of U.S. Distribution System
If you’ve been paying attention to climate trends, you’ve probably seen the chart from NOAA demonstrating the growth in billion-dollar disasters over time. There were 25 separate billion-dollar disasters in 2023. To fully contextualize this phenomenon about the electric grid, the U.S. Energy Information Administration offers data on power grid interruptions for blue sky days and major event days.
The trend demonstrates a roughly 50% increase per year in severe weather outages while blue sky outages stay flat, making one thing clear: the way we’ve been investing in the grid works well for reliability during normal conditions, but not for resilience during extreme weather conditions.
An aging grid compounded with more severe weather events means that we need to invest more in the grid and do it in a smarter way.
As utilities invest more capital on infrastructure hardening than ever and the federal government puts an historical amount of dollars to work, utilities must also adapt their investment prioritization models, which often look at limited, historic data sets. A study by McKinsey estimates that utilities can unlock 40-60% of value from capital assets by using advanced analytical approaches.
Current multivariate attribute value functions used by utilities are typically limited — incorporating asset health scores, outage data and certain other variables — and tend to rely on historical information and traditional statistical methods. These methodologies are ineffective in planning for future scenarios and understanding the impact of extreme weather on utility assets such as poles, conductors, cross-arms and transformers. A causal inference approach — the ability to attribute some asset failure as a result of a threat or combination of threats — is critical to understanding the relationships and quantifying the impact of various weather conditions on a variety of utility assets.
In order for decision optimization models to adequately reflect future environmental conditions, utility data sets need to be enriched with information that represents physical threats to their infrastructure, such as weather, vegetation, topographical information and aerial imagery. This geospatial contextualization can then be coupled with global and regional climate models to understand not only how extreme weather trends will increase in the future, but how they will result in vulnerability on the power system.
Diving into the world of climate data
Coupling climate projection data with historic data sets is no small task. For almost 20 years, scientists have been conducting experiments and running climate models to better understand natural changes in response to radiative forcing from an increase in greenhouse gas emissions. This work has evolved into the Coupled Model Intercomparison Project, or CMIP, which coordinates experiments, simulations and models to publish standardized data sets globally for various climate variables, and forecasts those variables over the long term according to various carbon emission scenarios. These data sets offer the best understanding of future climate conditions.
However, the data sets in their current state are usually not conducive to performing quantitative analyses on utility assets — they’re coarse, temporally disparate, and require immense amounts of bias correction and validating with ground-truth weather and climate observations.
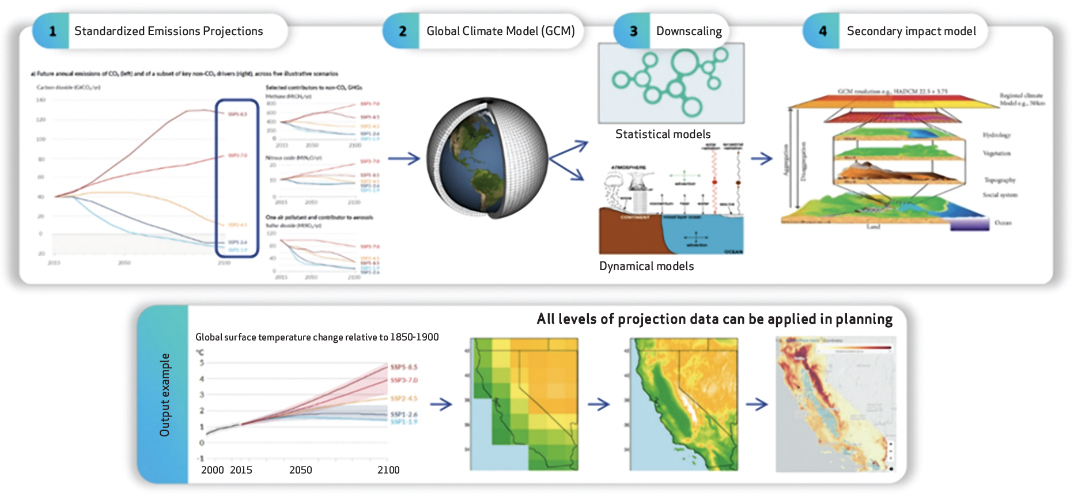
Figure 3. Sequential modeling process for climate projections (Sources: IPCC AR6, NOAA, AI-Ghadi et al. (2020), USGS)
Understanding scenarios
When climate models are run, they’re done according to various emissions scenarios known as the Shared Socioeconomic Pathways (SSP). It takes different scenarios of inputs such as global population, GDP and policy activity to project emissions profiles and subsequent global mean temperature increases.
For utilities, it’s important to understand which scenarios to model against when quantifying extreme weather risk. For instance, if one were to assume SSP5, the highest emission scenario, then the climate risk profile would be extremely high — in anticipation of much greater severity and frequency of extreme weather events — and would result in more favorable cost-benefit metrics for resilience-enhancing investments.
Utilities must be able to determine which scenarios to choose and how to compare them against each other when assessing future risks, creating resilience plans, and making the corresponding investments.
Diagnosing the symptoms
All along the chain, from generation to behind the meter, a changing climate is anticipated to have enormous consequences.
Generation: In the Pacific Northwest, higher temperatures are likely to lead to increased drought conditions, putting many of the hydroelectric generators at risk of future production challenges. For a state like Washington, where 65% of its electricity comes from hydropower, planning for this threat to resource adequacy is essential. Similarly, as long-term patterns related to wind and solar irradiance change across the country, wind and solar developers will need to adjust generation projections over the typical 25-year lifetime of their projects.
Transmission: In the Northeast, longer winter cold snaps are starting to result in greater ice buildup on transmission lines, causing excessive sagging and degradation, and in some cases immediately causing the line to break. In the Southeast and Puerto Rico, more frequent and intense tropical storms and hurricanes have the potential to bring down large swaths of transmission lines, which will cause long-duration regional economic disruptions and negatively impact communities’ health and safety.
Distribution: Distribution infrastructure, because it is so geographically vast and tends to be more vulnerable than other grid assets, is especially at risk of failures and disruptions from natural threats. High winds have the ability to snap old, degraded poles. Intense precipitation can flood underground networks and substations. Extreme temperatures can cause transformers and other expensive components to overload and degrade more rapidly. Vegetation is also a serious threat, as distribution infrastructure commonly exists along tree canopies that are taller than the conductors, paving the way for significant potential contact between vegetation and poles and conductors.
Behind-the-Meter: In many states that have implemented specific energy transition policies, such as incentivizing electrification, heat pumps and other electric appliances are supplanting fossil fuel-based appliances such as furnaces and gas stoves. In colder regions, it’s likely that new winter peaks will emerge as consumers increasingly rely on the power grid to heat their homes. During polar vortex and other cold snap periods that are likely to become more common, the duration of those low temperatures could last up to a few days, potentially leading to winter load-shedding events that simply can’t be solved by demand response or other temporary load-shifting strategies.
Measuring the damage
Once we have an understanding of the hazards that may present themselves on the grid, we need to understand the impact of that hazard. The best way to think about impact is to unpack what happens during an extreme weather event. For simplicity, let’s focus on hurricanes and their impacts on a distribution system.
When a hurricane hits, power lines are susceptible to toppling over and flooding can cause underground equipment to go offline. The result is that hundreds of thousands of homes and businesses lose power for a long duration. Commercial businesses are unable to operate, industrial activity comes to a halt, food spoils and vulnerable populations experience health and safety risks. Simultaneously, electric distribution operators activate massive emergency workforces and call on mutual aid to restore the system and replace damaged equipment. The restoration effort for Hurricane Ian, for instance, cost $1.1B.
A study published in October 2023 by Rowan University demonstrated that hurricanes in the Atlantic Ocean are now twice as likely to grow from a weak storm into a major Category 3 or higher hurricane within just 24 hours.
Tracking the anticipated future changes in losses from disruptions helps understand the type of investments that should be made and their magnitude. If the grid is like our bodies, then new patterns of hurricanes and other climate hazards are like new viruses. Every new virus requires a new immunization tailored to the characteristics of the threat itself.
Designing the treatment plan
Just like when you go to the doctor for health concerns, the grid is in need of a treatment plan for these new and changing climate threats. If the first step is diagnosing the challenges, the next step is identifying all the possible mitigation options and having a clear understanding of the potential outcomes.
Distribution operators and engineers have an enormous toolbox to choose from to reduce the vulnerability of specific climate threats. Vegetation management, replacing or upgrading wooden poles to steel or composite, reinforcing cross-arms and replacing cold-end hardware are all forms of system hardening that help reduce the probability of wind- and storm-related outages. To reduce the impact of these events, distribution automation devices such as reclosers and fuses can help automatically restore power for a subset of customers, even if certain parts of the grid experience disruptions. Lastly, distributed energy resources such as batteries and microgrids not only help mitigate peak load during extreme temperature days but can provide life-saving backup power for communities that need essential resources during catastrophic events.
In thinking about the enormity of the distribution system, there are trillions of scenarios in which a multitude of investments could be made in a specific section of a feeder. To combat the short-term and existential resilience challenge, prioritization is more valuable than ever. Having the understanding of which assets are likely to fail, based on component design standards, age, condition, proximity to vegetation and fragility to a climate event, and which specific investment provides the greatest benefit stack per cost, is the key to closing the current $500B resilience gap.
Equity considerations are becoming increasingly important within the context of resilience planning as well. Some communities are more prone to hardship and difficulty attaining life-saving resources than others. Poor neighborhoods, areas with significant elderly populations, rural communities and even communities that specifically lack transportation resources that inhibit the ability to reach places with power, should all be taken into consideration when weighing resilience investments.
Climate isn’t the only thing that’s changing
The picture of risk across a utility’s distribution system is constantly changing, but that’s not only due to external threats like climate and weather. Utility customers and the system itself are going through transformations. We are increasingly relying on electricity for transportation and heating. New infrastructure such as data centers, telecommunications equipment and manufacturing facilities are being connected. Backup generators and microgrids are allowing customers to operate even if the grid goes down. And, spurred in part by the Infrastructure Investment and Jobs Act, distribution assets are being replaced and reinforced daily.
It isn’t easy to keep track of the fluidity of all these pieces, which is why the industry needs a Fitbit for resilience. Much like developing a health plan, the energy transition is about envisioning a better future, and information is key to meeting our goals. Leveraging the vast amount of climate data available — and performing in-situ system resilience tracking — is the only way to a happy, healthy grid for the long term.
 Mishal Thadani is the co-founder and CEO of Rhizome, a climate resilience software company. Thadani is a recipient of Public Utilities Fortnightly 40 Under 40 and is a Clean Energy Leadership Institute Fellow.